Maysak Relief Map
An evidence-aware geospatial workspace for reviewing Typhoon Maysak relief coverage, village-level records and volunteer field data in Guangxi.
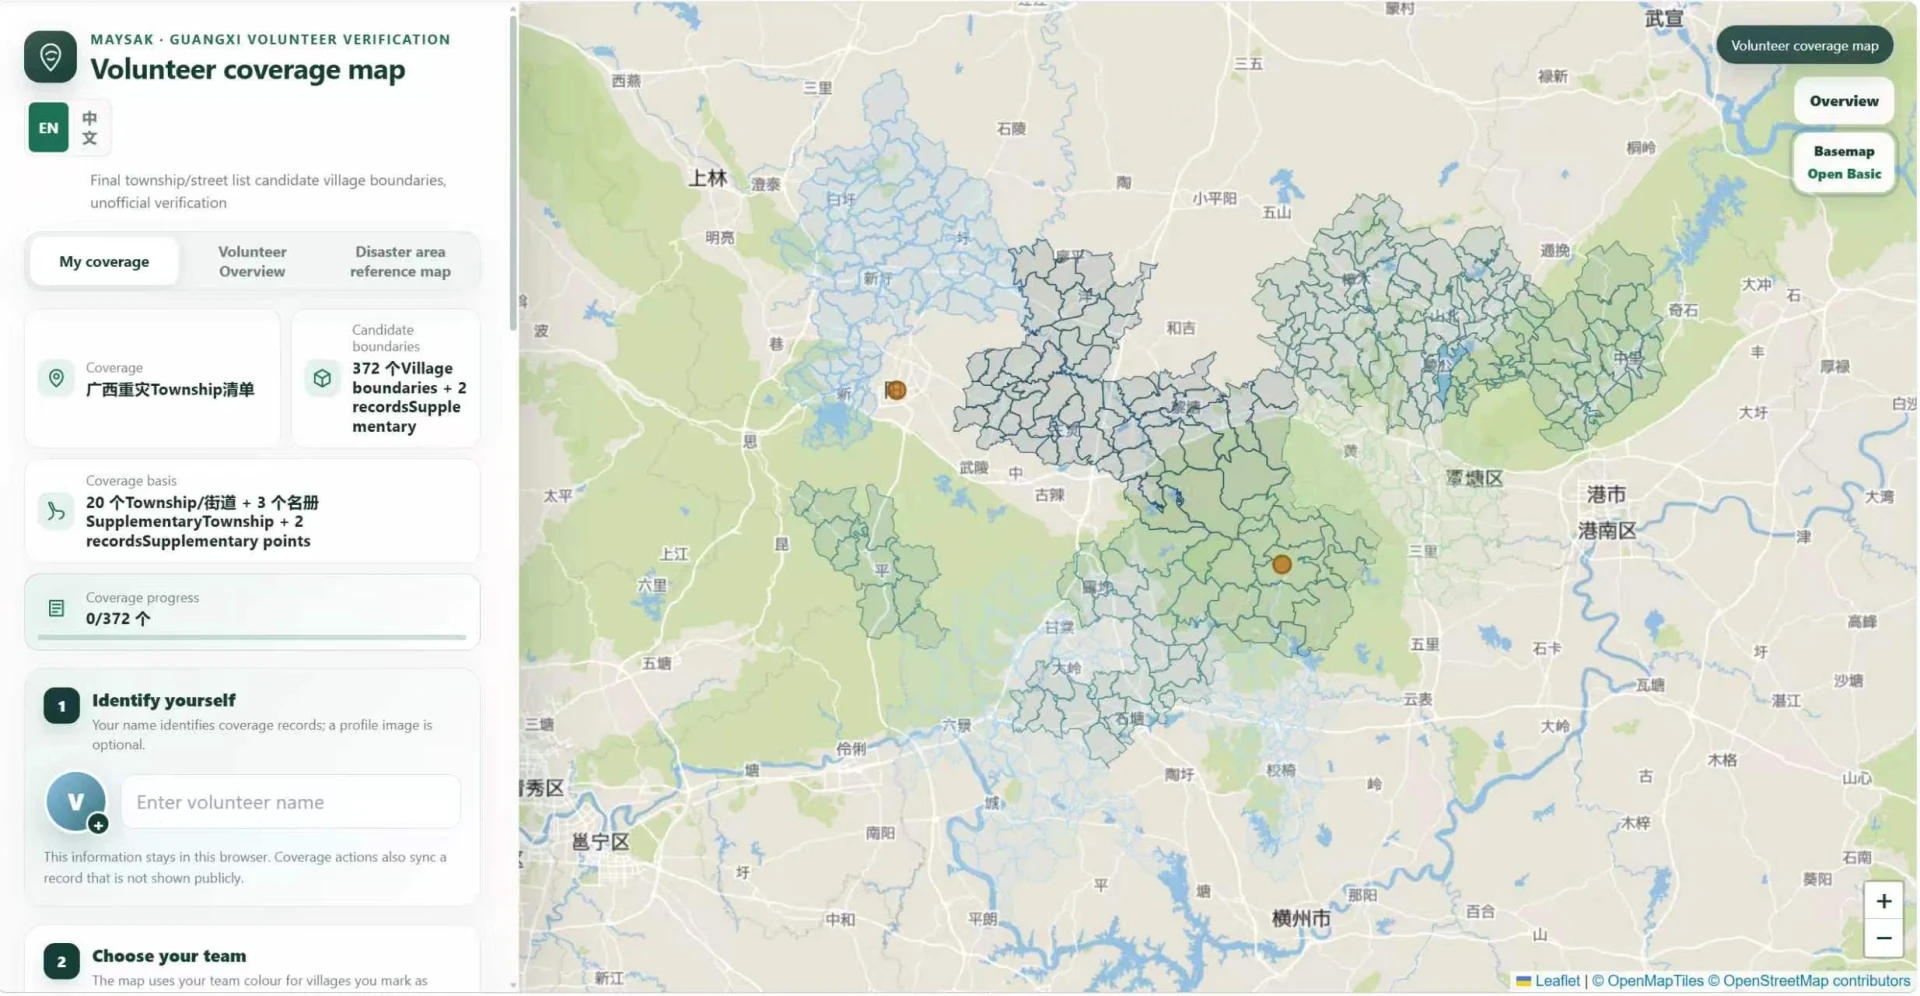
From volunteer records to a shared map
Maysak Relief Map brings village boundary candidates and volunteer workbook records into a geographic view of relief work in Guangxi. A volunteer can find a village, mark it with their group’s colour, and review their recorded activity alongside the wider map. The interface includes personal records, a volunteer overview and a disaster reference image.
Coverage and the limits of the data
The public demo checked on 7 September 2026 contains 374 geographic features: 372 candidate village boundaries and two supplementary points. Its coverage follows a list of 20 townships or subdistricts, with three additional townships from volunteer records. The supplementary points represent an organisation and a command centre; they are not counted as village boundaries.
The boundary layer comes from a third-party compilation, not an officially confirmed government dataset. The data panel exposes its source, date, geometry status and known uncertainty. These distinctions let a reader separate a volunteer’s map record from independently verified relief coverage.
Finding and marking a village
- Enter a display name, optionally add an avatar, and choose the responsible volunteer group.
- Search by village, township or administrative code, or narrow the map with a district filter.
- Select a village and mark it on the map; group colours help distinguish the recorded activity.
Rosters and images to share
The volunteer overview supports CSV roster import, a downloadable CSV template, avatar import and filtering by group. Export controls provide a map panorama, a collective commemorative image and individual images, including a batch export option. The personal image combines an avatar, marked-village count and the recorded area.
Mapping and language switching
The application uses Leaflet for the interactive map, GeoJSON for geographic features and canvas-generated images for exports. English and Chinese switch in place across controls, dialogs and generated labels, while retaining the map extent, layers, filters and selected feature. Source information stays visible alongside the map so users can review the evidence behind what they see.